Representation Function
Robert P. Munafo, 2023 Mar 30.
A representation function is simply a function that converts information about a point into a form that is useful for displaying in an image. The functions in the Color article are representation functions.
The following definitions refer to the standard iteration calculation:
Z0 = 0
ZN+1 = ZN2 + C
In each definition, N refers to the iteration number, and R refers to the radius or complex magnitude of an iterate.
In the following example illustrations, the coordinates are:
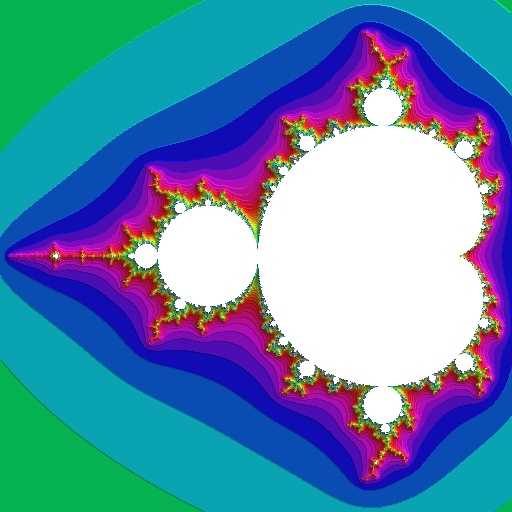
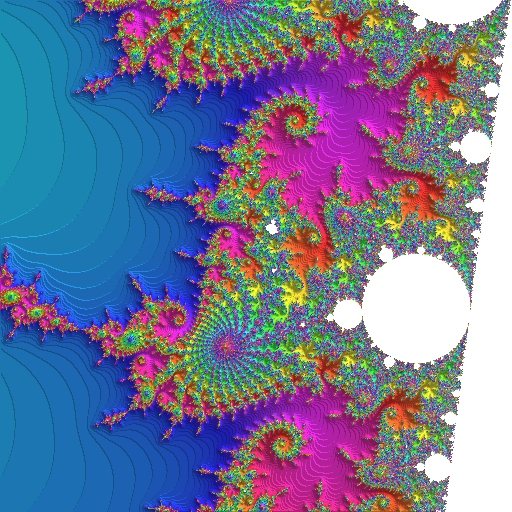
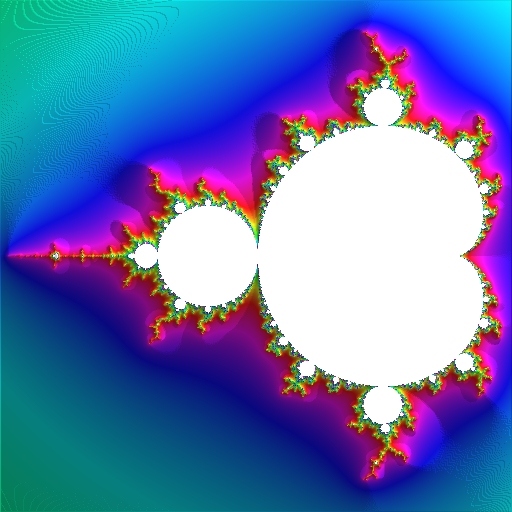
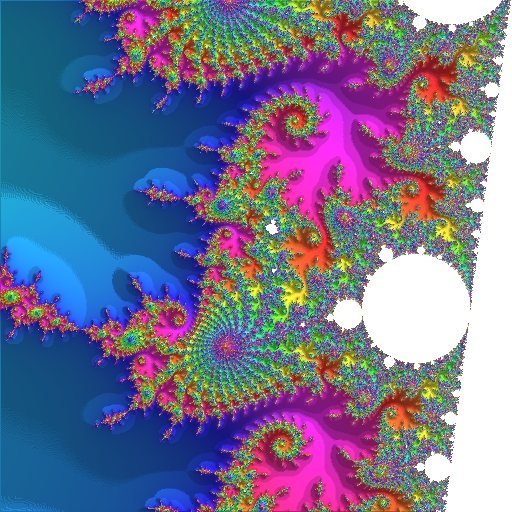
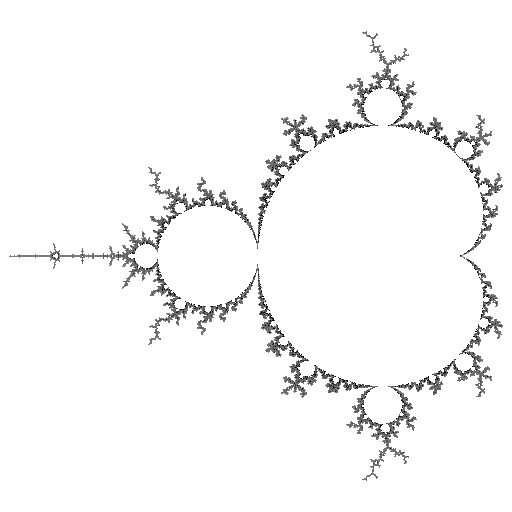
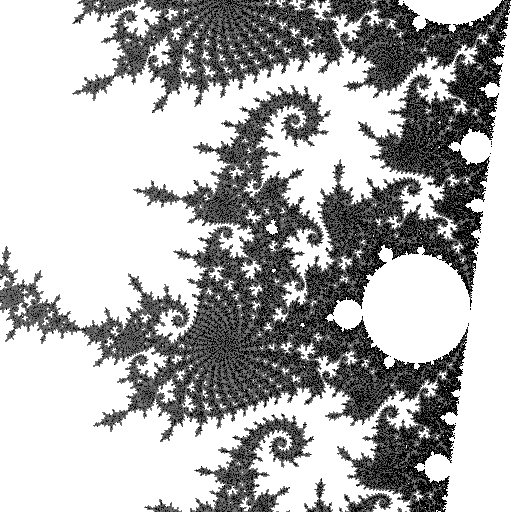
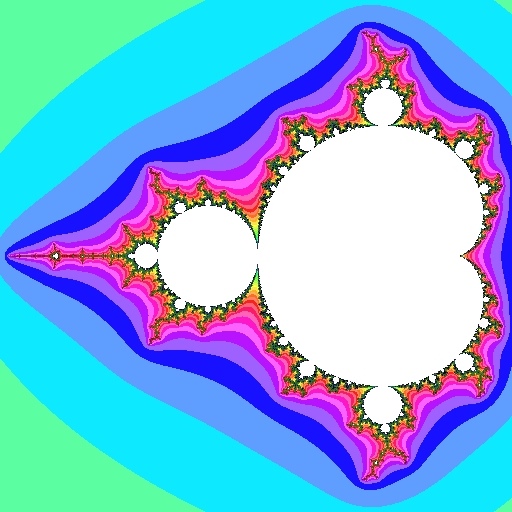
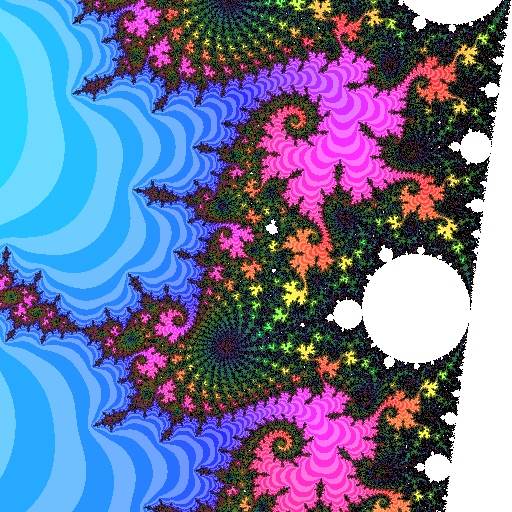
left image: center: -0.76 _ 0i, size 2.56 right image: center: -1.249736 +0.031604i, size 0.004
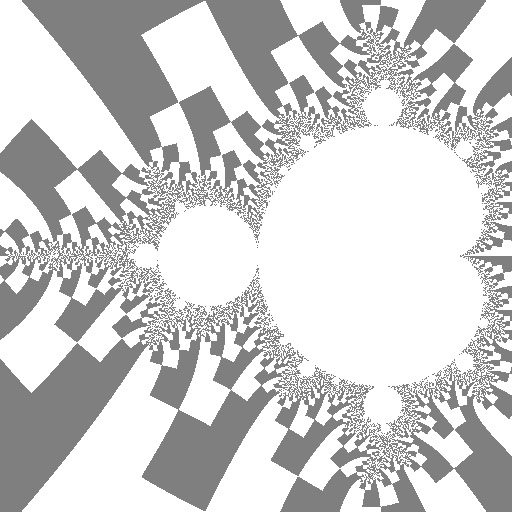
Escape Iterations (dwell)
|
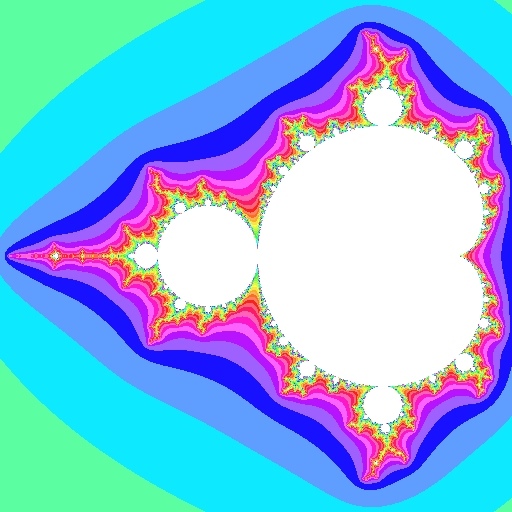
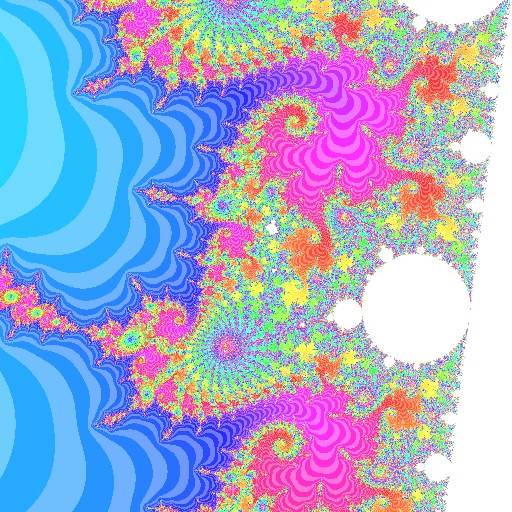
EscapeIterations = N(Max(R)) = Max(N)
The number of iterations at escape (also called dwell) is the value of N when R reaches a maximum. Because R is constrained by the escape radius, this ends up being equal to Max(N), the maximum value of N.
This is the traditional way of representing the Mandelbrot Set (described in e.g. the Scientific American article).
Continuous Dwell
|
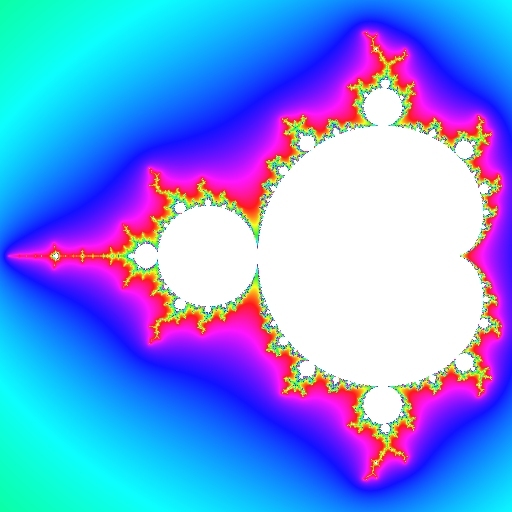
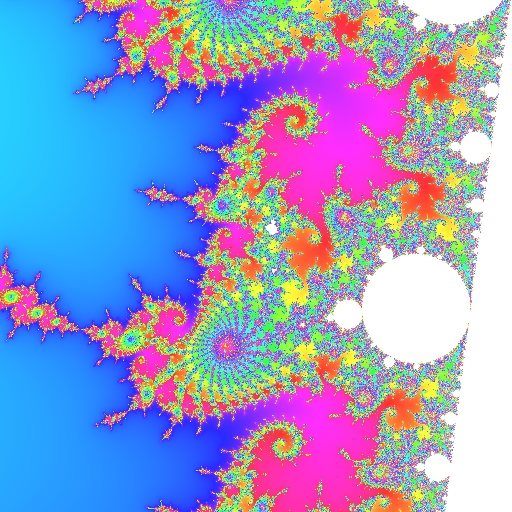
This method, described in the continuous dwell article, does the EscapeIterations algorithm and adds a fraction in the range [0,1) that is computed as:
D = n + log2(log2(|Zn|)) - log2(log2(EscapeRadius))
where n is the EscapeIterations value as described above, |Zn| represents the magnitude of the final iterate value and EscapeRadius is the escape radius.
|
This is a common technique to make an image appear as though points have "height" related to their dwell. For each pixel, after computing its colour as seen above, the pixel is made brighter if nearby pixels to the lower-left are "higher" (by having a higher dwell value) and the pixel is made darker if the pixels to the upper-right are "higher".
Quasi-3D with Continuous Dwell
|
If the previous two methods (continuous dwell and quasi-3D) are used together, a greater 3-D effect results. Level sets are no longer visible because every point has a different "height". (Some Moiré patterns appear in e.g. the upper-left corner of the first image, because the fractional part of the continuous dwell was computed with only about 3 digits to the right of the decimal point.)
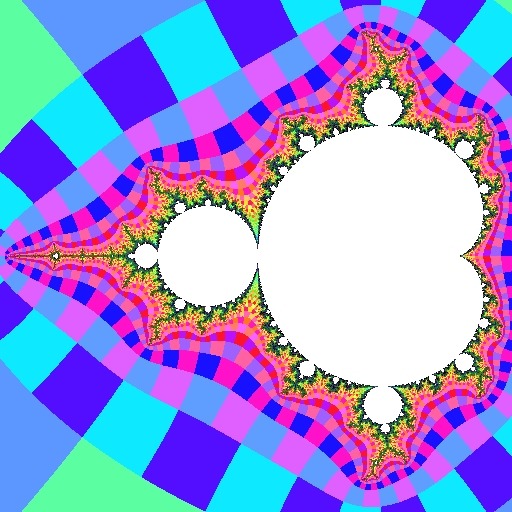
External Angle or Binary Decomposition
|
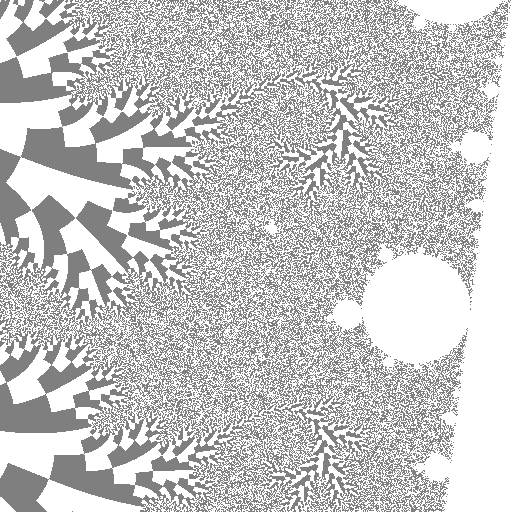
ExternalAngle = SUMk=1..n[2-k sign(Zk)]
For a point not in the Mandelbrot set, there is an external angle in the range [0..1), or sometimes [0..1] with 1 and 0 treated as equivalent. The only mathematically correct definition is the Böttcher coordinate as described in the ExternalAngle article, but a good visualisation can be achieved using just the last iteration Zn if a suitably large escape radius is used.
The value of Z at the last iteration can be treated as a complex number in either the form:
Zn = a+bi
or:
Zn = Reiθ
Both forms admit to a variety of visualisations using the two dimensions of information to choose from a two-dimensional range of colours. The magnitude R was already mentioned above as part of the continuous dwell calculation. To visualise the external angle the value θ can be plotted as a color, or (as shown here) one of two colours can be chosen based on whether θ is greater or less than π (or equivalently, whether the imaginary component b is negative or positive).
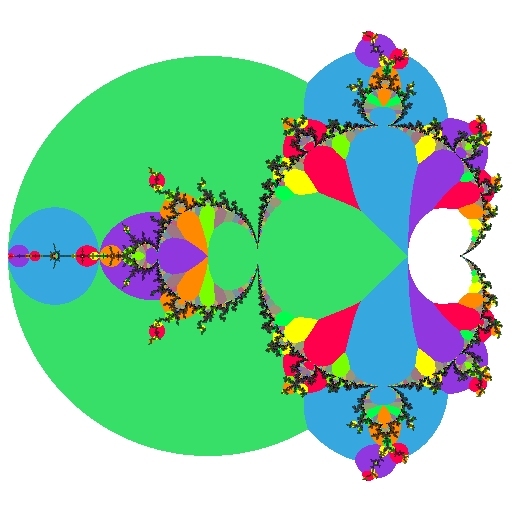
Atom Domain (nearby Period)
|
For reference, the filaments are also shown using DEM/M
A particularly informative view assigns colors to the (integer-valued) atom domain function
AtomDomainPeriod = N(Min(R))
This is the value of N when RN=|ZN| reaches a minimum (not counting the initial value R0=|Z0| which is always zero). For practical purposes we only check a finite number of ZN (just as with any other Mandelbrot iteration algorithm).
This representation function and its uses are discussed more fully in the atom domain article. There are more images in the second-order embedded Julia set article.
Distance Estimator Method for Mandelbrot (DEM/M)
|
distance estimate = ln(z2) * z / dz
The z in the formula is the "last" Z, that is ZN for the largest value of N, that was iterated; and dz is the iterated deriviative. See the distance estimate for full pseudo-code of the algorithm.
|
This simply means plotting distance estimator and escape iterations at the same time, which is accomplished by using a two-parameter mapping into the three-dimensional color space (see color).
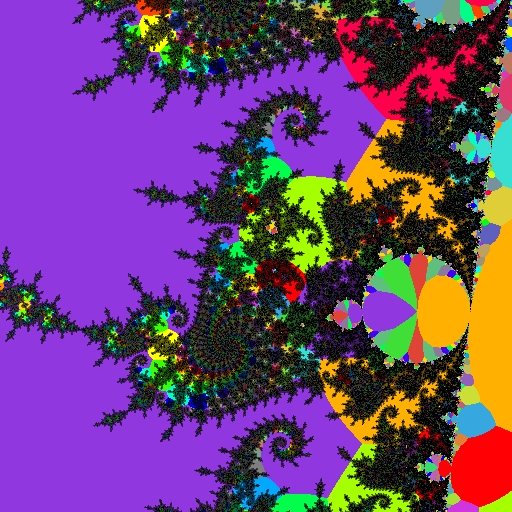
DEM, Dwell and Binary Decomposition
|
.jpg)
Here we are plotting all three of distance estimator, escape iterations, and external angle at the same time (the latter by binary decomposition) to show even more information in one view. This is the method used for most of the color images in Mu-Ency.
Iterate Tracks or Buddhabrot
|
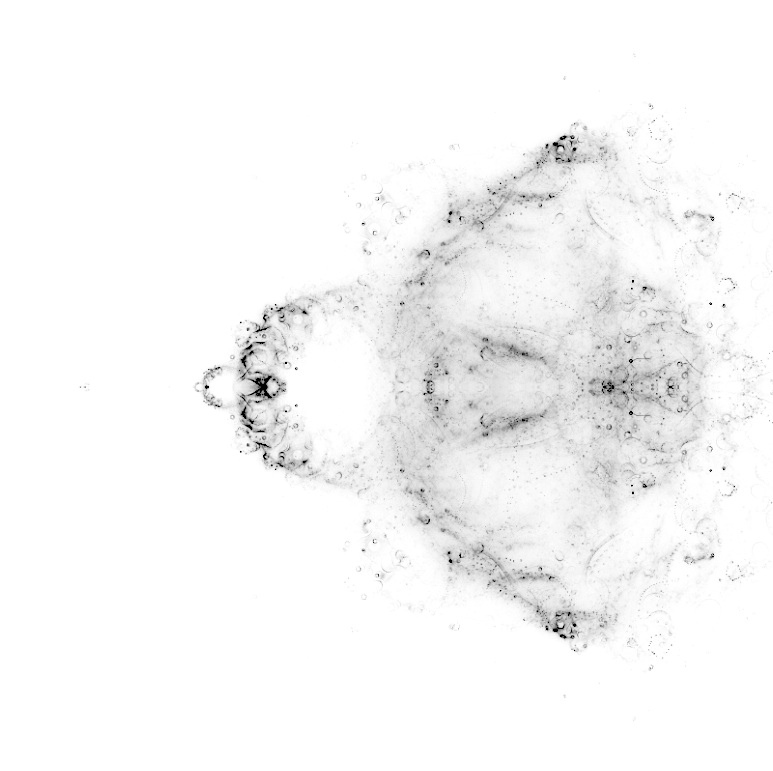
A Buddhabrot view plots every Iterate value ZN during iteration of ZN+1 = ZN2 + C for every possible value of C. This is like the Inverse-Iteration Method, except going forwards using the Mandelbrot iteration formula, not going backwards with the Julia Set formula. See the Buddhabrot article for more about this plotting method.
See also Color.
Acknowledgments
The atom domains function is from Scott Huddleston scott(at)math orst edu.
revisions: 20020420 oldest on record; 20110116 clarify the use of "N" and "R"; 20120416 add figures; 20120421 add more figures and improve descriptions; 20120424 expand DEM/M description; 20221212 add introductory paragraph; 20230320 add coordinates and continuous dwell examples, many small edits; 20230326 add quasi-3D (embossed); 20230330 add quasi-3D with continuous dwell; 20230408 mention Böttcher formula
From the Mandelbrot Set Glossary and Encyclopedia, by Robert Munafo, (c) 1987-2024.
Mu-ency main page — index — recent changes — DEMZ
This page was written in the "embarrassingly readable" markup language RHTF, and was last updated on 2023 Jun 28.
 s.27
s.27