Buddhabrot
Robert P. Munafo, 2023 Jun 21.
Name given by Lori Gardi to the plotting technique invented by Melinda Green, which renders the Mandelbrot Set in a way similar to the Inverse-Iteration Method but using forward iteration and plotting the iterates in parameter space. If viewed sideways (with West at the top and North to the right) the Continent appears a bit like certain images of Buddha.

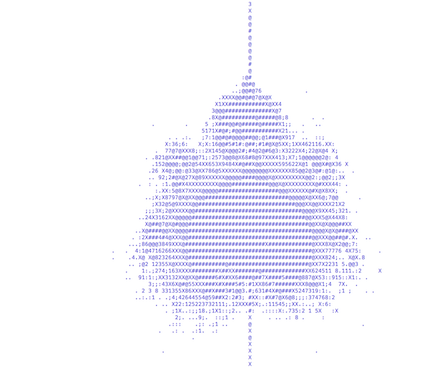
Buddhabrot image from Wikipedia Commons
Related colloquial terms for features in this image are: topknot, head, shoulders, body.
To produce a Buddhabrot image, pick a dwell limit as usual, and select a view that includes the entire Mandelbrot Set. Then, iterate as you would for a Mandelbrot image (see iteration algorithm), and find out if the iteration escapes. If it escapes, then look at every value of Z that occurred to see which pixel that Z value falls in (some Z values will be outside the view). Keep a count for each pixel, recording how many times a Z value fell within that pixel. After all the points have been iterated (or occasionally while iterating) plot all the pixels, choosing a color for each pixel based on the recorded count.
If you want to view a low-resolution image quickly, you have to choose points (values of C) to iterate in some way other than a normal grid scan. Melinda Green, Paul Bourke and Marc Jaouen choose points at random, however this produces a noisy "snow" effect that makes it necessary to do much more iteration before the subtle details of the Buddhabrot image become visible. A grid scan, or an interleaved stagged grid scan like that used in ordered dithering will reduce (but not eliminate) the noise.
Explanation of Appearance
The standard Buddhabrot image shows all the Iterates of Z0=0, but no iterates for any other initial Z. As such, it shows the orbits, which contain different numbers of attracting points depending on the periods of the individual orbits. However because non-escaping points are not included, the bounded orbits do not get plotted, the Buddhabrot image only contains iterates of 0 for the Fatou dusts. The points that have high dwell values dominate, and their orbits include many points that fall near the value of C used for that iteration. The C values of points with high dwells are the points near the boundary of the Mandelbrot set, and that is why the Buddhabrot image contains an image of the Mandelbrot set.
There are also many rotated and enlarged copies in different places. All of the rotated and enlarged copies are preimages under the iteration of the escaping C values. The number of copies depends on the various periods of the orbital dynamics near the points being iterated. For example, there is one extra image of the area around R2.1/2a, two extra images each of the areas around R2.1/3a and R2.2/3a, and so on. The images of the smaller mu-atoms are fainter because fewer iterates contribute to them. Because of the Squaring that occurs to the iterate once per period in its iteration, many of the preimages have the characteristic shape of a Mu-molecule, a cardioid with mu-unit decorations, and the cardioid's cusp is near the origin.
Projections From 4 Dimensions
The basic Buddhabrot image is a particular case of an axonometric projection from the 4-dimensional Julia-Mandelbrot Space collapsed onto a two-dimendional plane (the image) letting us see the sum or average of the 4-dimensional object with respect to the Z parameter plane.
Because a 4-dimensional Euclideam space has six orthogonal plane "axes" (i.e. 6 combinations of the four linear axes), there are six ways to combine the components of z and c to create a Buddhabrot-like view. For each of the six, we can choose to plot only for the member points, or we can choose to plot only for the escaped points.


These are the standard Mandelbrot set views, original Brooks-Matelski on the left, standard view with dwell bands on the right.

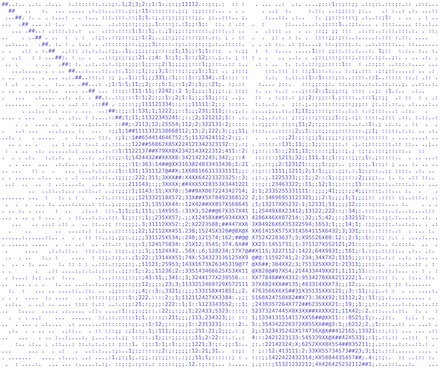
combined imaginary: zi and ci

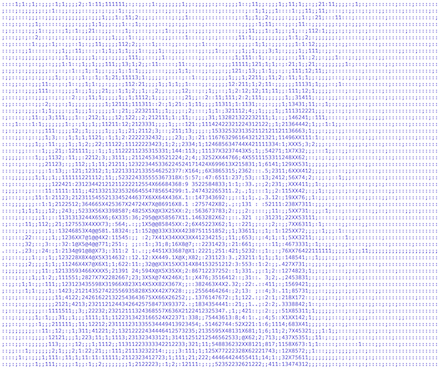
imaginary iterate zi vs. real parameter cr

real iterate zr vs. imaginary parameter ci


combined real: zr and cr
The view on the left incorporates the bifurcation diagram of iterates on the real axis, but there is "more stuff" because we're also plotting iterates of points with nonzero imaginary component.
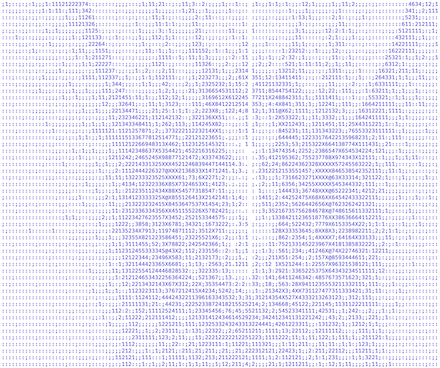
plane of iterates (standard Buddhabrot on the right)
See also: Web pages by Melinda Green, Lori Gardi, Marc Jaouen and/or Paul Bourke. (To find any of these, use a search engine to search for these names or for "Buddhabrot")
See also The Amygdalan Sects, Mandelbrot Monk.
Here is some crude pseudo-code using an array that is 1000×1000 (a million elements total):
large_array = malloc(1000*1000*sizeof(int)) for (x=0; x<1000; x++) { for (y=0; y<1000; y++) { cr = ((float) x) / 250.0 - 2.0; ci = ((float) y) / 250.0 - 2.0; zr = zi = 0.0; for (n=0; n<1000; n++) { // Iterate: (zr,zi)^2 + (cr,ci) -> new zr,zi r2 = zr*zr; i2 = zi*zi; ri2 = zr*zi*2; zr = r2-i2+cr; zi = ri2+ci; // remember iterates iter_history_r[n] = zr; iter_history_i[n] = zi; } if (zr*zr+zi*zi < 4.0) { // this iteration did not "escape" } else { // at least one coordinate (zr or zi) is very large (or "Infinity" // or "NaN"), so we can consider this point to have "escaped" for (i=0; i<n; i++) { // retrieve one of the iterate values zr = iter_history_r[i]; zi = iter_history_i[i]; // convert zr,zi to pixel coordinates J and K J = (zr + 2.0) * 250.0; K = (zi + 2.0) * 250.0; // we will use these pixel coordinates as array indices if (J and K are both in range 0 to 999) { large_array[J,K]++; } } } } } for (x=0; x<1000; x++) { for (y=0; y<1000; y++) { convert large_array[x,y] to a color (typically 0 is black, large values are white, and other values are in between) plot pixel at (x,y) } }revisions: 20221015 first version; 20230621 "axonometric", add 12 pictures
From the Mandelbrot Set Glossary and Encyclopedia, by Robert Munafo, (c) 1987-2024.
Mu-ency main page — index — recent changes — DEMZ
This page was written in the "embarrassingly readable" markup language RHTF, and was last updated on 2023 Jun 21.
 s.27
s.27