 |
David Eck's MANDELZOOM
|
How to Use the Program
You can use the program without knowing anything about the mathematics of the Mandelbrot set. Drag your mouse (or your finger if using a touch screen) on the image, which draws a rectangular box around part of the image. When you release the mouse button, the part of the image inside the box will be expanded to fill the entire image. Look for interesting things along the boundary of the white region, or along the filaments that extend from that region.
About MaxIter: The program has to do some computation to decide whether a point is colored or is white. The "MaxIterations" setting tells how much work it will do before giving up and making the point white. As you zoom in, you might need to increase MaxIterations to color in some white regions that really should be colored. For example, the image on the left below has white pixels that should be colored. Clicking the "More" button to increase MaxIter from 250 to 2500 produced the image on the right:

About the colors: The colors in the images are arbitrary. Use the "Edit Colors" settings (described below) to change them. If you find that the colors in the image are too uniform, you can try decreasing the value in "Palette Length". For example, changing the setting in that menu from 250 to 50 transformed the picture on the left to the picture on the right:

Conversely, if there are too many colors, try increasing the "Palette Length". Here, I increased it from 100 to 1000.

If you change the "Offset" setting, the same set of colors will be used, but they will be applied to the image differently. Using a different Offset can sometimes bring out details -- and sometimes produces a more attractive image.
Several different sets of colors are available within the Edit Colors controls described below. Select a name like "Earth and Sky" and click the "Install" button set the colors. The default palette, which the program uses when it starts up and when you use the "Home" button, is called "Pastels." Perhaps most useful is the "Random" option; just keep hitting "Install" to get different colors each time.
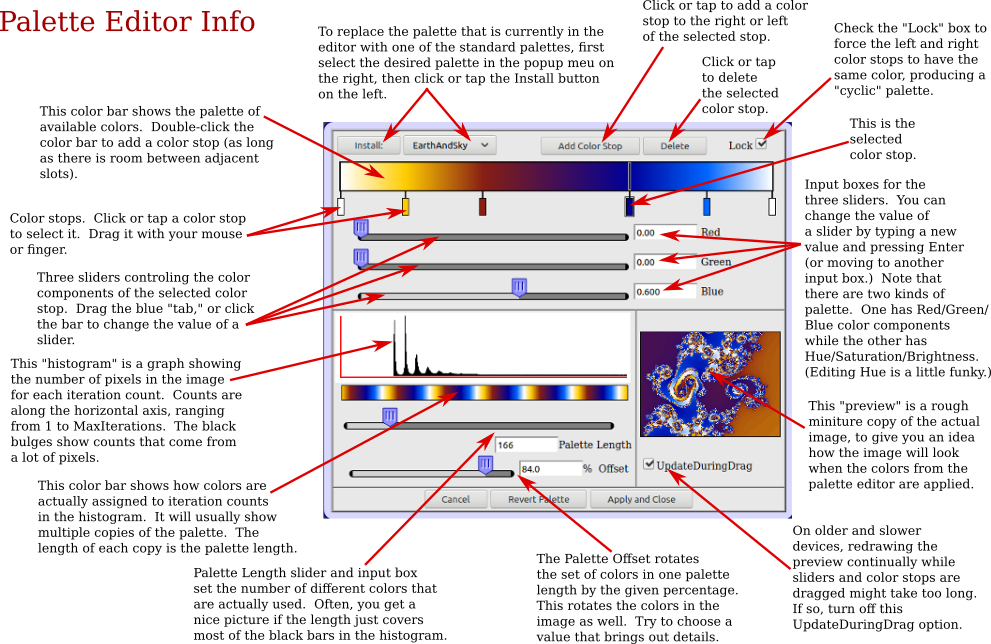
About the Color Editor: The button labeled "Edit Colors" will bring up an overlay window that gives you control over the "palette" of colors used in the image. Hover your mouse over an item to get information about it. For a more complete guide to the palette editor, see below or follow this link.
About Workers: The Mandelbrot Viewer is a computation-intensive program. Most computers today are "multi-core", which means that they can do several computations simultaneously. To do that on a web page, the page can use several "worker threads." By default, the Mandelbrot program uses only one worker thread. You can make it use more by changing the setting of the "Workers" menu. For example, if your computer is "quad-core", then setting the "Workers" menu to 4 might make the program run four times as fast. This requires that the web browser actually lets the viewer use all four cores, and assumes that your computer is not doing any other intensive work.
More About Zooming and High Precision: I've already said that you can drag a box on the image to zoom in. There are also buttons for zooming in and zooming out. If you are using a mouse, you have more flexible options for zooming. Hold down the shift key as you make the box to zoom out instead of zooming in (the current image will be shrunk down to the inside of the box). Double-click on the image to zoom in by a factor of two. The point where you double-click will be moved to the center of the image; if you want to leave that point in the same place, hold down the ALT/Option key as you double-click. You can also shift-double-click to zoom out.
If you zoom in far enough, the program will switch to "high precision" computations. Ordinary numbers on a computer have a limited number of decimal places. As you zoom in, those numbers will eventually not have enough accuracy to do the required computation. The high-precision mode can handle any number of decimal places -- but it is much slower than the usual precision.
Saving your Work: Some browsers (Chrome and Firefox) make it possible to save the image from the program. Right-click or control-click the image and choose "Save Image" or "View Image." ("View Image" will open the image in a new page, and you can save it from there.)
To load or save the coordinates and other settings that produced the image, or to recover settings for some other image: Click the "Coordinates and XML ..." button. This will show a text input box and some buttons that you can use to view, load, and save settings. They're in a format called "XML". You don't need to understand the format, but from the names like "xmin" you should be able to tell what most of the data is for. Colors are given as RGB (red, green, blue) or HSB (hue, saturation, brightness), with three numbers on a scale of 0.0 to 1.0, so for example an RGB color='0;0;0.6' means dark blue.
You can copy-and-paste the settings from the text-input box into a text editor program, where you can save them in a file.
If you have edited anything or copied settings from elsewhere, remember to click the "Apply" button to use the new coordinates or palette, etc. and (re)generate an image. (Note that the settings can include an image size in pixels, but that is ignored when the settings are loaded.)
If you edit the coordinates, or wish to specify new coordinates, there are three acceptable ways to give them:
- A center and size, given as center_real, center_imag, and view_size
- A center with separate width and height, given as center_real, center_imag, real_width, and imag_height
- Left and right "limits" given as xmin and xmax, and bottom and top limits given as ymin and ymax
The order shown here is the order it tries, so for example if the center_real, center_imag, and view_size are all present, then xmin, xmax, etc. will be ignored. If none of the three methods works (because one or more of the parameters is missing) then no changes are made.
About the Java Version
This "web app" version of the Mandelbrot Viewer is a replacement for an older Java applet by David Eck. The Java version has more features than the web app (notably, more control over the palette and the ability to distribute long computations among several computers on a network). But applets are no longer supported in web browsers. The standalone Java program is still available on David Eck's website. Click here for information and downloading links.
Note that the web app version and the Java version of the program use the compatible settings files. You can get settings from one version and use them in the other.
Some Mathematical Details
The Mandelbrot set is a set of points a+bi in the complex plane. It lies entirely inside the circle centered at (0,0) with radius 2. To find out whether the point a+bi is in the Mandelbrot set, do the following computation:
   let x = a
   let y = b
   repeat
     let new_x = x*x - y*y + a
     let new_y = 2*x*y + b
     let x = new_x
     let y = new_y
     let iterations = iterations + 1
   until ((x*x+y*y) > 2*2) or (iterations > MaxIterations)
If the computation ends because the value for (x,y) is outside the circle centered at (0,0) with radius 2, then the initial point a+bi is not in the Mandelbrot set. The Mandelbrot set is defined as the set of points a+bi for which the iteration never leaves that circle.
Since it is not possible to continue the computation an infinite number of times, a MaxIterations value must be used. Because of this, the computation never definitively proves that a point a+bi is in the Mandelbrot set.
To get a visualization of the Mandelbrot set, we do the iteration for each pixel in the image. If the iteration reaches the maximum number of steps, we color that pixel white. (Remember that this only means that the point might be in the Mandelbrot set.) Otherwise, the pixel is assigned a color that depends on the number of iterations that were done before (x,y) left the circle of radius 2. That number can be thought of as a measure of how far the point is from being in the Mandelbrot set -- the more iterations, the closer the point is to the set. In the program, the number of iterations is used to select a color according to the settings seen in the "Edit Colors" controls.
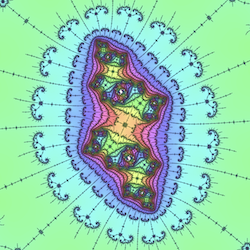
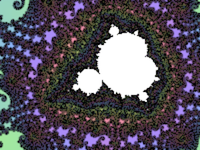
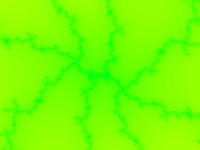
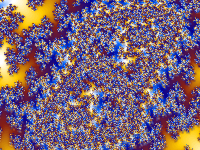
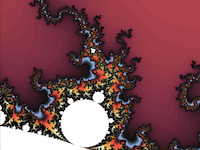
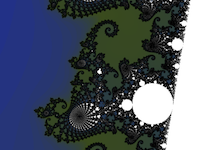
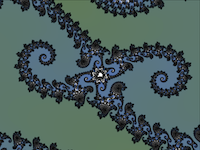
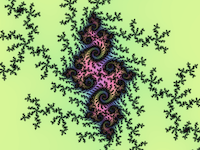
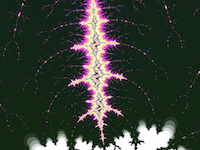
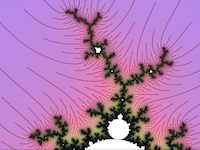
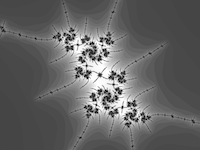
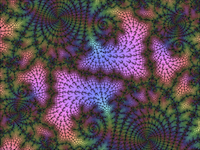
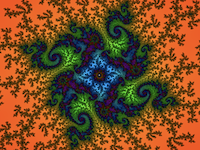
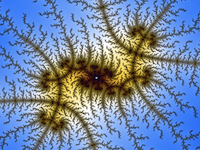
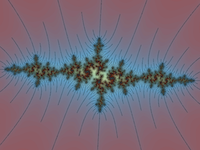
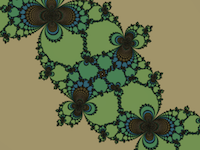
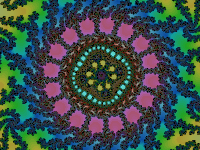
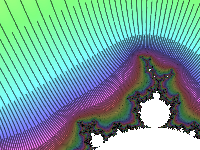
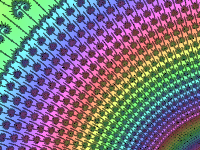
Some Loadable Examples
Here are some images from the program. Click on one of the images to open the program's web page and load that example. The program will render a larger-size version of the image. You can then use the program to do some further exploration. For example, Zoom Out (0.2x) several times to see the neighborhood of the example in the full Mandelbrot set. You will usually see several striking images along the way! (There is also a large, unorganized collection of examples on the original site by David Eck, that you can view in his version of the program.)
 |
 |
 |
 |
 |
 |
 |
 |
 |
 |
 |
 |
 |
 |
 |
 (1024 zoom)
 |
 (1049 zoom)
 |
 (10103 zoom)
 |
How can I ... ?
... Change the colors?
Use the "Customize Colors" button. Here is David Eck's lovely guide to all the controls. A bit of the terminology has changed but the actual instructions are still valid:
... Get the source code for DEMZ and its examples?
Read the source code README for details; but briefly you need to download demz-program.tar.gz, extract its files, and then read README.rhtf (which is a plain text file) for further instructions.
... Make these huge buttons smaller?
On most browsers, including phones, you can enlarge or reduce the size of things in a webpage using 'zoom in' or 'zoom out' commands. If you don't know how, ask someone more familiar with your type of device or browser.
... Make these tiny buttons and text larger?
On most browsers, including phones, you can enlarge or reduce the size of things in a webpage using 'zoom in' or 'zoom out' commands. If you don't know how, ask someone more familiar with your type of device or browser.
... Run this viewer from a local copy?
To make a local copy of this Mandelbrot viewer, you need the
files: index.html, BigDecimal-all-last.js,
mandelbrot-worker.js, info.html,
and palette-editor-info.png. Use
wget or curl in the Terminal on either Linux or Mac,
and save them all into the same directory. Then double-click
your copy of "index.html" and it should
appear in your browser.
If the Mandelbrot image window
is blank:
In Firefox visit about:config,
then search for "fileuri", and change the
security.fileuri.strict_origin_policy to false.
In Safari enable "Develop menu" in the
Advanced tab of Settings and then choose "Disable local file
restrictions" and "Disable Cross-Origin Restrictions" from the Develop
menu.
... Save the image?
You can save the fruits of your MANDELZOOMing by taking a screen-shot. In addition, well-designed browsers let you right-click on the image and Save Image As....
... Set an exact value for the Max. Iterations?
Use the "Coordinates and XML..." button, look for "max_iterations value='...'" and change the number inside the quotes but without changing the punctuation.
... Set an 'escape radius' value?
Use the "Coordinates and XML..." button, select the "as MZCONF" option, look for "escapeRadius=2.828", and change the number after the equals sign. It only allows values from 2.0 to 26.9.
... Zoom more easily?
Predecessors of this viewer had a single button to zoom in, but if you wanted to zoom in by a different amount than the last time, you had to use a pull-down menu to change the zoom amount (two more clicks), meaning three clicks to perform a rare zoom like "out by 100x" and a couple more clicks to return the zoom-out to a more useful amount like 2x. DEMZ instead has the four zoom buttons hard-wired to 1/5x, 4/5x, 6/5x, and 5x. The same three clicks now gets you a 125x zoom in or out. Additional tip: For fine-tuning, click 0.8x and 1.2x once each to zoom out by 4%.
20230505 row-by-row version